
Your Step-By-Step Guide To Retail Demand Forecasting

[ad_1]
Retail demand forecasting is all about predicting future customer demand using historical data, market trends, and a bit of that gut feeling honed by experience. Whether you’re running a cozy boutique or a sprawling e-commerce empire, nailing your forecasts means fewer stockouts, less overstock, and a happy, satisfied customer base.
Why Retail Demand Forecasting Is Crucial for Your Business
Why should you care? Because accurate demand forecasting is your ticket to smoother operations and healthier profits.
Picture this: You perfectly forecast the holiday rush, stock up just enough inventory, and avoid both empty shelves and unsold products gathering dust. That’s the dream scenario. Good forecasting helps you optimize everything from purchasing to staffing, making sure every cog in your retail machine runs like clockwork.
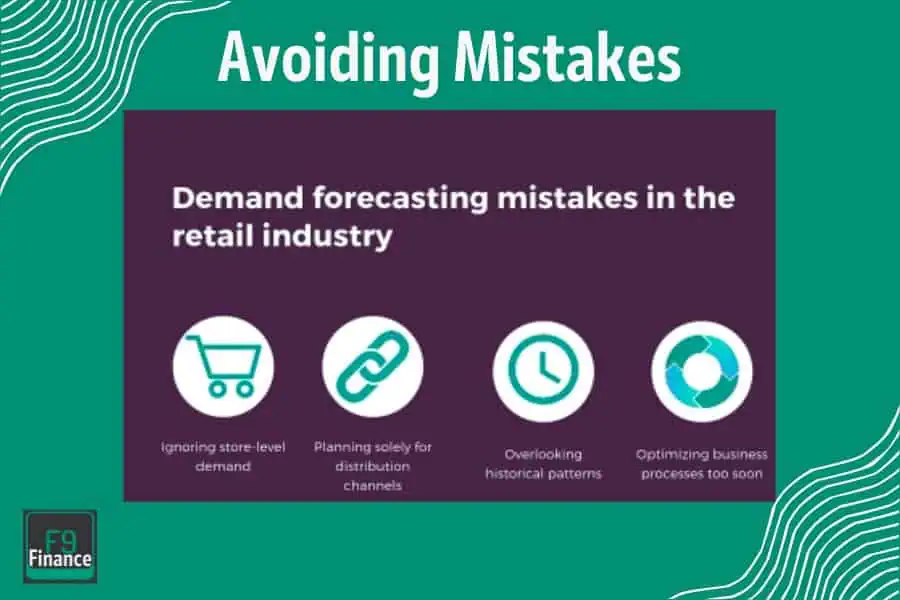
The Consequences of Poor Forecasting
Now, let’s talk about what happens when you get it wrong. It’s not pretty. Imagine hyping up a flash sale, only to run out of stock within hours. Not only do you lose immediate sales, but you also tick off customers who might just take their business elsewhere. On the flip side, overestimate demand, and you’re stuck with excess inventory that ties up capital and eventually goes on clearance at a loss. It’s a tightrope walk, and poor forecasting can push you off balance, straight into the financial abyss.
Understanding the Basics Of Retail Demand Planning
So, what exactly is demand forecasting? It’s the process of predicting future customer demands for products or services to ensure you have the right amount of stock at the right time. The main goal here? To strike that perfect balance between too much and too little inventory. Too much, and you’re stuck with unsold goods; too little, and you’re leaving money on the table.
Key Concepts and Terminology
Let’s break down some key terms you’ll need to get cozy with:
- Historical Data: This is your bread and butter. Past sales records, market trends, and customer purchasing habits all feed into your forecasts.
- Lead Time: The period between ordering new stock and having it ready for sale. Get this wrong and you could end up with empty shelves.
- Seasonality: Those predictable fluctuations in demand based on the time of year. Think holiday rushes or back-to-school spikes.
- Forecast Accuracy: A measure of how close your forecasts are to actual sales. It’s like your report card, and trust me, you want straight A’s here.
The Role of Historical Data
Now, let’s talk history. No, not the boring kind with battles and treaties—the kind that actually affects your bottom line. Historical data is essentially a gold mine of insights. By analyzing past sales trends, customer behaviors, and market conditions, you can make more informed predictions about future demand. It’s like having a cheat sheet for your business decisions.
Real-Life Example: The Pitfalls of Ignoring Past Trends
Picture this: A retailer decides to wing it, ignoring last year’s data. They assume the upcoming summer will be just like the previous one.
Spoiler alert—it wasn’t.
A new competitor entered the market, the weather was unusually cool, and consumer preferences shifted. The result? They were left with a mountain of unsold swimwear while losing potential customers who couldn’t find what they were looking for. All of this chaos could’ve been avoided with a solid look at historical trends and adapting to the current landscape.
Types of Demand Forecasting Methods
Welcome to the buffet of demand forecasting methods. Think of this as your toolkit – each tool has its strengths, and knowing when to use which one can make all the difference. Let’s break it down into two main categories: qualitative and quantitative methods. Each has its own vibe, pros, and cons.
Qualitative Methods

Qualitative methods are all about the human touch. These approaches rely on expert insights, market research, and customer feedback. They’re great when data is scarce or you need to gauge sentiment and trends that numbers alone can’t capture.
Expert Opinion
Sometimes, you just need to ask the people who know their stuff. Expert opinion involves gathering insights from industry veterans, consultants, or even your in-house gurus. Their experience can provide valuable foresight, especially in uncharted territories where historical data might be lacking.
Market Research
Market research is like holding a magnifying glass to your market. It involves surveys, focus groups, and other direct interactions with your customers. Want to know what your customers are planning to buy next season? Just ask them. Market research can reveal trends and preferences that numbers alone might miss.
Example: How a Small Retailer Used Customer Surveys to Predict Holiday Sales
Let me spill some tea on a small retailer who nailed it with customer surveys. They sent out a simple online questionnaire asking their regulars what gifts they were planning to buy for the holidays. The insights were gold. They discovered a surprising interest in eco-friendly products and adjusted their inventory accordingly. Result? Their holiday sales soared, while competitors who didn’t bother with such intel were left playing catch-up.
Quantitative Methods

Quantitative methods are the nerdy side of forecasting – they rely on hard data and mathematical models. These methods can handle large datasets and provide precise, reliable forecasts.
Time Series Analysis
Time series analysis looks at historical data points over time to identify patterns and trends. It’s like watching the stock market – past performance might not guarantee future results, but it definitely provides clues. This method is particularly useful for businesses with a lot of historical sales data.
Causal Models
Causal models go a step further by identifying relationships between different factors. For instance, if you sell umbrellas, looking at weather patterns can help predict demand. These models can factor in external variables like economic indicators, marketing campaigns, or even social media buzz.
Moving Averages
Moving averages smooth out short-term fluctuations to highlight longer-term trends. By calculating the average sales over a set period, you can get a clearer picture of your typical demand. It’s simple but effective, particularly for stable markets without wild swings in demand.
Example: Using Regression Analysis in Seasonal Businesses
Here’s a story about a seasonal business that got regression analysis right. They sold winter sports gear and noticed that their sales were heavily influenced by snowfall amounts. By using regression analysis, they correlated historical sales data with weather patterns to predict future demand.
When a heavy snow season was forecasted, they stocked up on extra inventory and saw their best winter sales ever. Meanwhile, those who ignored the weather reports ended up with empty shelves and missed opportunities.
Steps To Accurate Demand Forecasting
Alright, it’s time to get our hands dirty with the actual steps to ace your demand planning game. This chapter is all about taking those theoretical concepts and putting them into practice. We’re diving into data collection, analysis, and choosing the right forecasting model that fits like a glove.
Step 1: Data Collection
Before you can start predicting the future, you need to gather your intel. Think of this as building your arsenal – the better your data, the stronger your forecast.
Not all data is created equal, so where do you get the good stuff? Here are some key sources:
- Sales Records: Your historical sales data is a treasure trove of insights.
- Market Trends: Industry reports and market research can reveal broader trends.
- Customer Feedback: Surveys, reviews, and direct customer interactions can offer real-time clues.
- Supply Chain Planning: Data from your suppliers about delivery times and stock levels.
Having tons of data is great, but if it’s garbage in, it’s garbage out. Here’s how to keep your data pristine:
- Clean and Validate: Remove duplicates, correct errors, and ensure consistency.
- Update Regularly: Outdated data is almost as bad as no data.
- Cross-Reference Sources: Verify your data by comparing multiple sources for accuracy.
Example: The Domino Effect of Bad Data on Forecast Accuracy
Let me share a horror story about a retailer who relied on faulty data. They didn’t bother cleaning their sales records, which were riddled with errors. When they used this messy data to forecast demand, they ended up overstocking items that barely sold and running out of hot products. It was a domino effect – one bad piece of data led to poor forecasts, which led to lost sales and wasted inventory. Lesson learned? Good data hygiene is non-negotiable.
Step 2: Data Analysis
With your high-quality data in hand, it’s time to play detective. Analysis is where you sift through the noise to find meaningful patterns and trends.
Look for recurring themes in your data. Are there certain times of the year when sales spike? Do some products consistently outperform others? Spotting these patterns helps you make more accurate predictions.
Dealing with Outliers
Outliers are those pesky data points that don’t fit the mold. Maybe it was an out-of-the-blue surge in sales due to a viral social media post. You need to decide whether to include or exclude these anomalies from your demand forecast. Sometimes they’re just noise, but other times they point to important shifts in consumer behavior.
Example: How Recognizing a Sales Spike Led to Better Inventory Management
Here’s a tale of success: A retailer noticed an unusual sales spike for a particular product during a specific week every year. By investigating further, they realized this coincided with a local festival that brought in tourists. Recognizing this pattern allowed them to stock up appropriately the next year, boosting their sales and keeping customers happy.
Step 3: Choosing the Right Forecasting Model
Now that you’ve got your data and analyzed it, it’s time to choose the forecasting model that will bring everything together. This is where the rubber meets the road.
Different businesses have different needs, and one size does not fit all. Consider factors like the nature of your products, market volatility, and available data when choosing a model.
Pros and Cons of Different Models
Here’s a quick rundown:
- Time Series Analysis: Great for stable markets with lots of historical data. Not so hot for new products or volatile markets.
- Causal Models: Perfect if you need to factor in external variables like marketing campaigns or economic indicators. More complex and data-intensive.
- Moving Averages: Simple and effective for smooth, consistent demand. Won’t work well if your market has lots of ups and downs.
Example: Why One Size Doesn’t Fit All in Forecasting
Imagine a retailer selling both electronics and fashion items. They initially used the same time series model for both categories. Bad move. Electronics sales were steady and predictable, so the model worked fine there. But fashion trends change faster than you can say “fast fashion.” They quickly realized they needed a different approach for each category to get accurate forecasts.
Implementing and Monitoring Your Demand Forecast
First, let’s get that forecast off the paper and into your business operations. This isn’t just about plugging numbers into a spreadsheet and calling it a day. It’s about weaving your forecast into the very fabric of your business processes.
Here’s how you make your forecast work for you:
- Inventory Management: Adjust your stock levels based on forecasted demand to avoid overstocking or stockouts.
- Staffing: Schedule your workforce according to expected busy periods to maintain efficiency and customer satisfaction.
- Marketing Campaigns: Align promotions with predicted demand spikes to maximize impact.
Communicating the Forecast Across Teams
A forecast is only as good as its execution, and for that, everyone needs to be on the same page. Clear communication is key:
- Regular Meetings: Hold briefings to ensure all departments understand and are aligned with the forecast.
- Accessible Reports: Make forecast data easily accessible to relevant teams through dashboards or regular updates.
- Feedback Loops: Encourage teams to provide feedback on the forecast’s accuracy and any anomalies they observe.
Example: How Clear Communication Prevented a Stock-Out Situation
Here’s a case study worth noting: A mid-sized retailer had a habit of keeping their forecasts under wraps, leading to frequent stock-outs. One year, they decided to change things up to improve supply chain efficiency.
They made sure their sales, marketing, and supply chain management teams were all in the loop about the latest forecasts. This transparency allowed the supply chain team to ramp up orders just in time for a massive sales event that the marketing team had planned. Result? Not a single stock-out and a significant boost in sales. Clear communication saved the day.
Monitoring and Adjusting the Forecast
Implementing a forecast is not a one-and-done deal. It’s a continuous process that requires regular monitoring and tweaking.
To keep your forecast on track, you need to set up Key Performance Indicators (KPIs) and metrics:
- Forecast Accuracy: Measure how close your forecasts are to actual sales.
- Inventory Turnover Rate: Track how quickly inventory is sold and replaced.
- Service Levels: Monitor the ability to meet customer demand without stockouts.
Continuous Improvement Cycle
Adopt a mindset of continuous improvement:
- Regular Reviews: Hold periodic reviews to assess the performance of your forecast.
- Flexibility: Be ready to adjust your forecast based on new data or unexpected changes in market conditions.
- Learning from Mistakes: Analyze what went wrong when forecasts are off and use those lessons to improve future predictions.
Advanced Techniques and Tools For Retail Demand Forecasting
Welcome to the future of demand forecasting. Advanced techniques are all about leveraging cutting-edge technology to make your predictions as accurate as possible.
Machine Learning and AI in Demand Forecasting
Machine learning and AI aren’t just buzzwords—they’re game-changers. These technologies can analyze vast amounts of data faster and more accurately than any human ever could. They learn from past data to detect patterns and make predictions that adjust in real-time.
- AI Algorithms: Use complex algorithms to handle nonlinear relationships and massive datasets.
- Predictive Analytics: AI can predict what products will be hot based on current trends, social media, and even weather patterns.
Big Data Analytics
Big data analytics involves processing and analyzing huge volumes of data to uncover hidden patterns, correlations, and insights. This is where you dig deep into details that traditional methods might miss.
- Real-Time Data Processing: Analyze data as it streams in from sales transactions, social media, and other sources.
- Customer Behavior Analysis: Understand purchasing behavior at a granular level to anticipate future demand.
Example: How a Major Retailer Leveraged AI to Refine Forecasts
Let’s talk about a major retailer who decided to bring out the big guns—AI. By integrating AI-powered predictive analytics into their forecasting process, they didn’t just rely on historical sales data. They factored in everything from online search trends to social media chatter. When an unexpected trend started gaining traction, their AI system flagged it early, allowing them to stock up before their competitors even knew what hit them. The result? A massive boost in sales and a reputation for always having the latest must-have items.
Common Challenges and Solutions
Every business faces hurdles when it comes to making accurate forecasts. Here are some of the most common ones:
Handling Seasonal Variations
Seasonality can be a double-edged sword. On one hand, it’s predictable if you know what to look for. On the other, it can throw your forecasts way off if you don’t account for it properly. The key is to recognize these patterns and adjust your forecasts accordingly.
- Challenge: Predicting peaks and troughs accurately.
- Solution: Use historical data to identify seasonal trends and factor them into your forecasts. Advanced tools can help by automatically adjusting for seasonality.
Managing Unexpected Market Shifts
The market can turn on a dime. Whether it’s a new competitor, a sudden change in consumer preferences, or even a global pandemic—unexpected shifts can wreak havoc on your forecasts.
- Challenge: Adapting to rapid changes in the market.
- Solution: Stay agile. Regularly update your forecasts with the latest data and be prepared to pivot quickly.
Example: The Impact of a Sudden Economic Downturn on Forecast Accuracy
Let’s talk about a retailer who was caught off guard by an economic downturn. They had been riding high on optimistic forecasts, but when the economy tanked, consumer spending plummeted. Their rigid forecasts didn’t account for this shift, leading to overstocked shelves and plummeting profits. The lesson? Always have a contingency plan and be ready to adjust your strategy when the market throws you a curveball.
Solutions and Best Practices
Here’s how to turn those forecasting nightmares into success stories:
- Diversify Data Sources: Don’t rely solely on sales data. Incorporate market research, economic indicators, and even social media trends to get a fuller picture.
- Regular Review and Adjustment: Make it a habit to review your forecasts regularly. Monthly check-ins can help catch potential issues before they become major problems.
- Scenario Planning: Prepare for multiple outcomes by creating different scenarios (best case, worst case, and most likely). This will help you stay prepared no matter what happens.
Case Study: A Retailer’s Comeback Story Post-Forecasting Failure
Let’s wrap up with a tale of redemption. A retailer once faced a major forecasting flop—they had forecasted sky-high sales for a new product line that ended up being a dud. Rather than throwing in the towel, they took a hard look at their forecasting process.
They diversified their data sources, started regular forecast reviews, and implemented scenario planning. The next time they launched a product, they were prepared for multiple outcomes and managed their inventory like pros. It was a textbook comeback story, turning their initial failure into a valuable learning experience.
[ad_2]