
Linear Discriminant Analysis (LDA) | by Ingo Nowitzky | Oct, 2024
[ad_1]
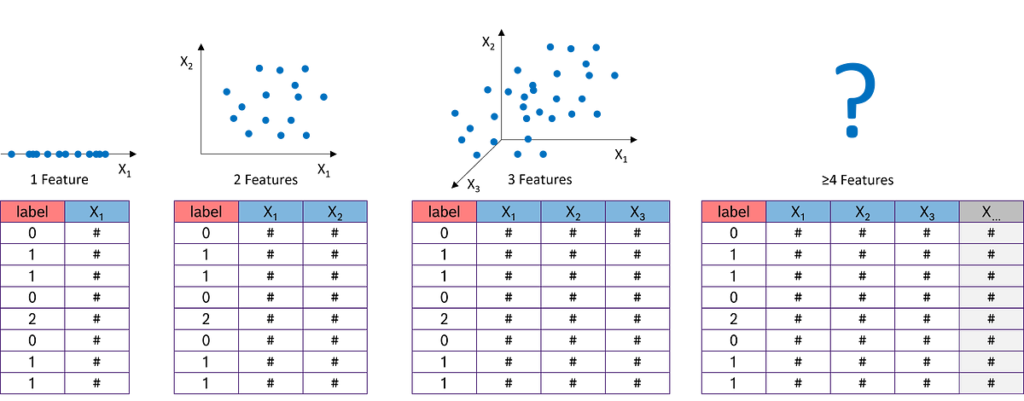
To demonstrate the theory and mathematics in action, we will program our own LDA from scratch using only numpy.
import numpy as npclass LDA_fs:
"""
Performs a Linear Discriminant Analysis (LDA)
Methods
=======
fit_transform():
Fits the model to the data X and Y, derives the transformation matrix W
and projects the feature matrix X onto the m LDA axes
"""
def __init__(self, m):
"""
Parameters
==========
m : int
Number of LDA axes onto which the data will be projected
Returns
=======
None
"""
self.m = m
def fit_transform(self, X, Y):
"""
Parameters
==========
X : array(n_samples, n_features)
Feature matrix of the dataset
Y = array(n_samples)
Label vector of the dataset
Returns
=======
X_transform : New feature matrix projected onto the m LDA axes
"""
# Get number of features (columns)
self.n_features = X.shape[1]
# Get unique class labels
class_labels = np.unique(Y)
# Get the overall mean vector (independent of the class labels)
mean_overall = np.mean(X, axis=0) # Mean of each feature
# Initialize both scatter matrices with zeros
SW = np.zeros((self.n_features, self.n_features)) # Within scatter matrix
SB = np.zeros((self.n_features, self.n_features)) # Between scatter matrix
# Iterate over all classes and select the corresponding data
for c in class_labels:
# Filter X for class c
X_c = X[Y == c]
# Calculate the mean vector for class c
mean_c = np.mean(X_c, axis=0)
# Calculate within-class scatter for class c
SW += (X_c - mean_c).T.dot((X_c - mean_c))
# Number of samples in class c
n_c = X_c.shape[0]
# Difference between the overall mean and the mean of class c --> between-class scatter
mean_diff = (mean_c - mean_overall).reshape(self.n_features, 1)
SB += n_c * (mean_diff).dot(mean_diff.T)
# Determine SW^-1 * SB
A = np.linalg.inv(SW).dot(SB)
# Get the eigenvalues and eigenvectors of (SW^-1 * SB)
eigenvalues, eigenvectors = np.linalg.eig(A)
# Keep only the real parts of eigenvalues and eigenvectors
eigenvalues = np.real(eigenvalues)
eigenvectors = np.real(eigenvectors.T)
# Sort the eigenvalues descending (high to low)
idxs = np.argsort(np.abs(eigenvalues))[::-1]
self.eigenvalues = np.abs(eigenvalues[idxs])
self.eigenvectors = eigenvectors[idxs]
# Store the first m eigenvectors as transformation matrix W
self.W = self.eigenvectors[0:self.m]
# Transform the feature matrix X onto LD axes
return np.dot(X, self.W.T)
To see LDA in action, we will apply it to a typical task in the production environment. We have data from a simple manufacturing line with only 7 stations. Each of these stations sends a data point (yes, I know, only one data point is highly unrealistic). Unfortunately, our line produces a significant number of defective parts, and we want to find out which stations are responsible for this.
First, we load the data and take an initial look.
import pandas as pd# URL to Github repository
url = "https://raw.githubusercontent.com/IngoNowitzky/LDA_Medium/main/production_line_data.csv"
# Read csv to DataFrame
data = pd.read_csv(url)
# Print first 5 lines
data.head()

Next, we study the distribution of the data using the .describe() method from Pandas.
# Show average, min and max of numerical values
data.describe()

We see that we have 20,000 data points, and the measurements range from -5 to +150. Hence, we note for later that we need to normalize the dataset: the different magnitudes of the numerical values would otherwise negatively affect the LDA.
How many good parts and how many bad parts do we have?
# Count the number of good and bad parts
label_counts = data['Label'].value_counts()# Display the results
print("Number of Good and Bad Parts:")
print(label_counts)

We have 19,031 good parts and 969 defective parts. The fact that the dataset is so imbalanced is an issue for further analysis. Therefore, we select all defective parts and an equal number of randomly chosen good parts for the further processing.
# Select all bad parts
bad_parts = data[data['Label'] == 'Bad']# Randomly select an equal number of good parts
good_parts = data[data['Label'] == 'Good'].sample(n=len(bad_parts), random_state=42)
# Combine both subsets to create a balanced dataset
balanced_data = pd.concat([bad_parts, good_parts])
# Shuffle the combined dataset
balanced_data = balanced_data.sample(frac=1, random_state=42).reset_index(drop=True)
# Display the number of good and bad parts in the balanced dataset
print("Number of Good and Bad Parts in the balanced dataset:")
print(balanced_data['Label'].value_counts())

Now, let’s apply our LDA from scratch to the balanced dataset. We use the StandardScaler from sklearn to normalize the measurements for each feature to have a mean of 0 and a standard deviation of 1. We choose only one linear discriminant axis (m=1) onto which we project the data. This helps us clearly see which features are most relevant in distinguishing good from bad parts, and we visualize the projected data in a histogram.
import matplotlib.pyplot as plt
from sklearn.preprocessing import StandardScaler# Separate features and labels
X = balanced_data.drop(columns=['Label'])
y = balanced_data['Label']
# Normalize the features
scaler = StandardScaler()
X_scaled = scaler.fit_transform(X)
# Perform LDA
lda = LDA_fs(m=1) # Instanciate LDA object with 1 axis
X_lda = lda.fit_transform(X_scaled, y) # Fit the model and project the data
# Plot the LDA projection
plt.figure(figsize=(10, 6))
plt.hist(X_lda[y == 'Good'], bins=20, alpha=0.7, label='Good', color='green')
plt.hist(X_lda[y == 'Bad'], bins=20, alpha=0.7, label='Bad', color='red')
plt.title("LDA Projection of Good and Bad Parts")
plt.xlabel("LDA Component")
plt.ylabel("Frequency")
plt.legend()
plt.show()
# Examine feature contributions to the LDA component
feature_importance = pd.DataFrame({'Feature': X.columns, 'LDA Coefficient': lda.W[0]})
feature_importance = feature_importance.sort_values(by='LDA Coefficient', ascending=False)
# Display feature importance
print("Feature Contributions to LDA Component:")
print(feature_importance)


The histogram shows that we can separate the good parts from the defective parts very well, with only a small overlap. This is already a positive result and indicates that our LDA was successful.
The “LDA Coefficients” from the table “Feature Contributions to LDA Components” represent the eigenvector from the first (and only, since m=1) column of our transformation matrix W. They indicate the direction and magnitude with which the normalized measurements from the stations are projected onto the linear discriminant axis. The values in the table are sorted in descending order. We need to read the table from both the top and the bottom simultaneously because the absolute value of the coefficient indicates the significance of each station in separating the classes and, consequently, its contribution to the production of defective parts. The sign indicates whether a lower or higher measurement increases the likelihood of defective parts. Let’s take a closer look at our example:
The largest absolute value is from Station 4, with a coefficient of -0.672. This means that Station 4 has the strongest influence on part failure. Due to the negative sign, higher positive measurements are projected towards a negative linear discriminant (LD). The histogram shows that a negative LD is associated with good (green) parts. Conversely, low and negative measurements at this station increase the likelihood of part failure.
The second highest absolute value is from Station 2, with a coefficient of 0.557. Therefore, this station is the second most significant contributor to part failures. The positive sign indicates that high positive measurements are projected towards the positive LD. From the histogram, we know that a high positive LD value is associated with a high likelihood of failure. In other words, high measurements at Station 2 lead to part failures.
The third highest coefficient comes from Station 7, with a value of -0.486. This makes Station 7 the third largest contributor to part failures. The negative sign again indicates that high positive values at this station lead to a negative LD (which corresponds to good parts). Conversely, low and negative values at this station lead to part failures.
All other LDA coefficients are an order of magnitude smaller than the three mentioned, the associated stations therefore have no influence on part failure.
Are the results of our LDA analysis correct? As you may have already guessed, the production dataset is synthetically generated. I labeled all parts as defective where the measurement at Station 2 was greater than 0.5, the value at Station 4 was less than -2.5, and the value at Station 7 was less than 3. It turns out that the LDA hit the mark perfectly!
# Determine if a sample is a good or bad part based on the conditions
data['Label'] = np.where(
(data['Station_2'] > 0.5) & (data['Station_4'] < -2.5) & (data['Station_7'] < 3),
'Bad',
'Good'
)
Linear Discriminant Analysis (LDA) not only reduces the complexity of datasets but also highlights the key features that drive class separation, making it highly effective for identifying failure causes in production systems. It is a straightforward yet powerful method with practical applications and is readily available in libraries like scikit-learn.
To achieve optimal results, it is crucial to balance the dataset (ensure a similar number of samples in each class) and normalize it (mean of 0 and standard deviation of 1).
The next time you work with a large dataset containing class labels and numerous features, why not give LDA a try?
[ad_2]